Advanced Features
Over the years the core functionality of fetching metrics from a set of plain Postgres DB-s has been extended in many ways to cover some common problem areas like server log monitoring and supporting monitoring of some other popular tools often used together with Postgres, like the PgBouncer connection pooler for example.
Patroni support
Patroni is a popular Postgres specific HA-cluster manager that makes node management simpler than ever, meaning that everything is dynamic though - cluster members can come and go, making monitoring in the standard way a bit tricky. But luckily Patroni cluster members information is stored in a DCS (Distributed Consensus Store), like etcd, so it can be fetched from there periodically.
When 'patroni' is selected as a source type then the connection
string should point to the DCS, and then pgwatch will
periodically scan the DCS and add any found and not yet monitored:
If you use etcd as the DCS, then your connection string should
look like this: etcd://host:port[,host:port..]/namespace/scope,
for example etcd://localhost:2379/service/batman.
For YAML based setups an example can be found from the instances.yaml file.
If Patroni is powered by etcd, then also username, password, ca_file,
cert_file, key_file optional security parameters can be defined in the
connection string, for example
etcd://username:password@localhost:2379/service/batman?ca_file=/path/to/ca.crt&cert_file=/path/to/client.crt&key_file=/path/to/client.key.
Also, if you don't use the standby nodes actively for queries then it might make sense to decrease the volume of gathered metrics and to disable the monitoring of such nodes with the "Primary mode only".
Log parsing
pgwatch can parse PostgreSQL server logs to count errors, warnings, and other log events. This feature only works when logs are in CSVLOG format.
Only event counts are stored - no error messages, usernames, or other details. Events are grouped by severity level for both the monitored database and the entire instance.
pgwatch automatically selects between two parsing modes:
-
Local mode - Used when pgwatch runs on the same host as the database server and can access log files directly. Requires OS user with read privileges on the logs directory and its files and
pg_read_all_settingsrole. -
Remote mode - Used when pgwatch runs on a different host. Requires
pg_monitorrole and execute privilege onpg_read_file(text, bigint, bigint).
To enable this feature, use the server_log_event_counts metric or a preset that includes it (e.g., full).
Note
pgwatch detects local mode when connected via a unix socket or when the data_directory system identifier matches the one from pg_control_system(). Otherwise, it falls back to remote mode.
For optimal performance, Local mode should be preferred for instances running on the same host as the database server.
Note
pgwatch reads from a single log file each interval with a maximum of 10MBs at a time. Knowing that and based on your log generation rate, adjust your metric interval to avoid having out-of-sync measurements.
PgBouncer support
pgwatch also supports collecting internal statistics from the PgBouncer
connection pooler, via the built-in special "pgbouncer" database and
the SHOW STATS command. To enable it choose the according DB Type,
provide connection info to the pooler port and make sure the
pgbouncer_stats metric or "pgbouncer" preset config is selected
for the host. Note that for the "DB Name" field you should insert not
"pgbouncer" (although this special DB provides all the statistics) but
the real name of the pool you wish to monitor or leave it empty to track
all pools. In latter case individual pools will be identified /
separated via the "database" tag.
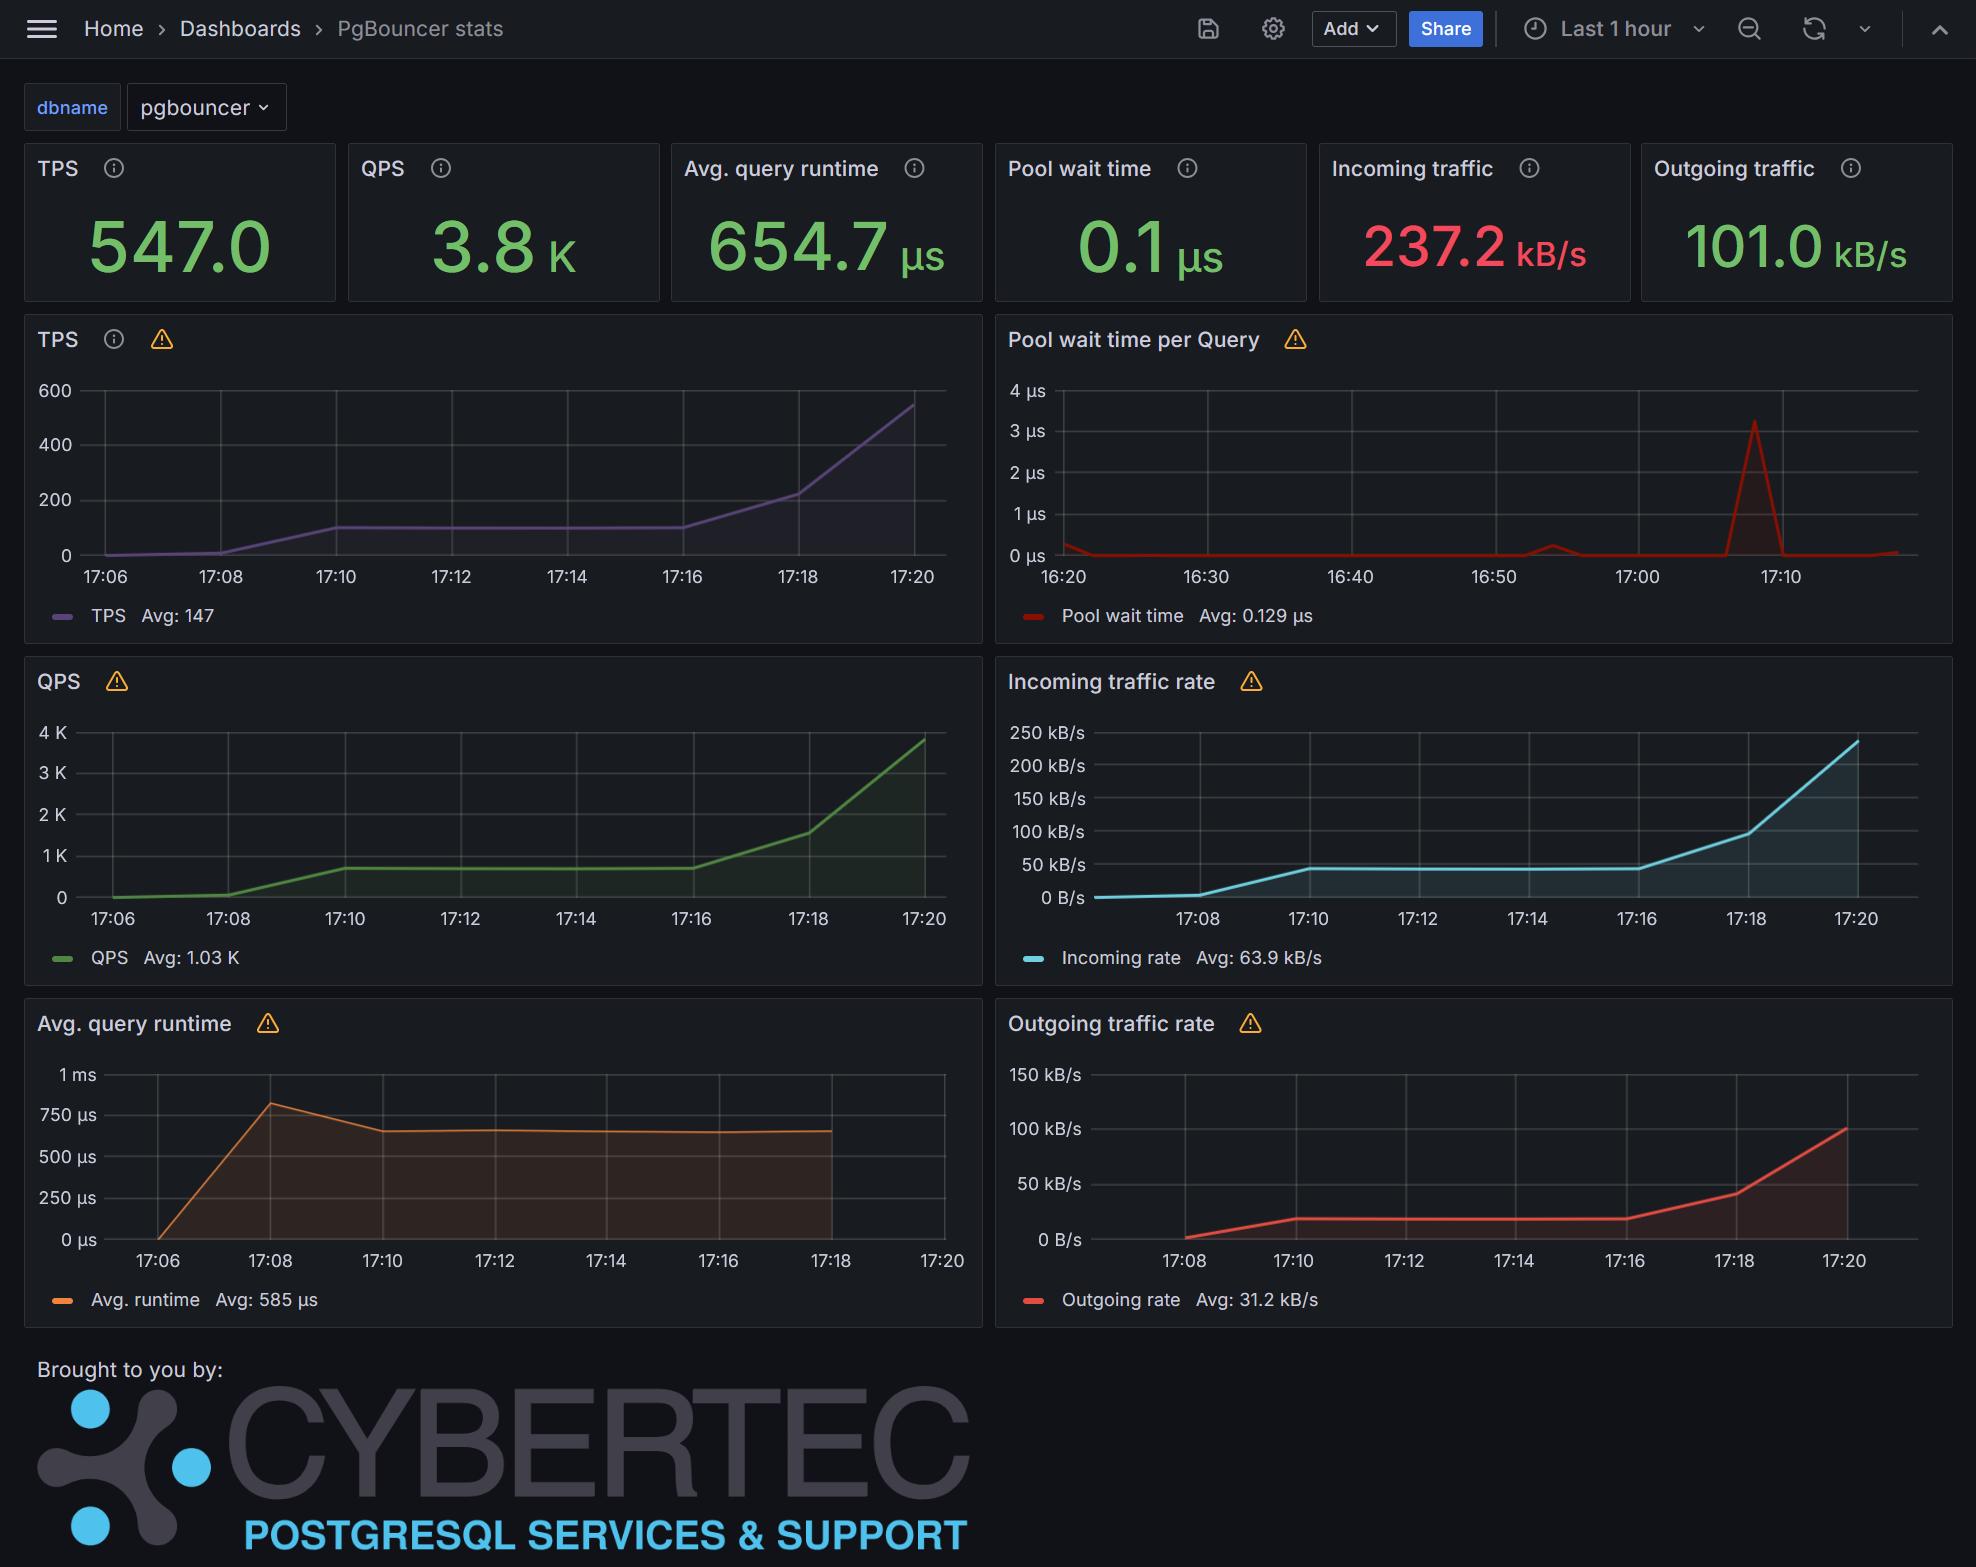
There's also a built-in Grafana dashboard for PgBouncer data, looking like that:
Pgpool-II support
Quite similar to PgBouncer, also Pgpool offers some statistics on pool performance and status, which might be of interest especially if using the load balancing features. To enable it choose the according DB Type, provide connection info to the pooler port and make sure the pgpool_stats and pgpool_processes metrics or pgpool preset config is selected for the host.
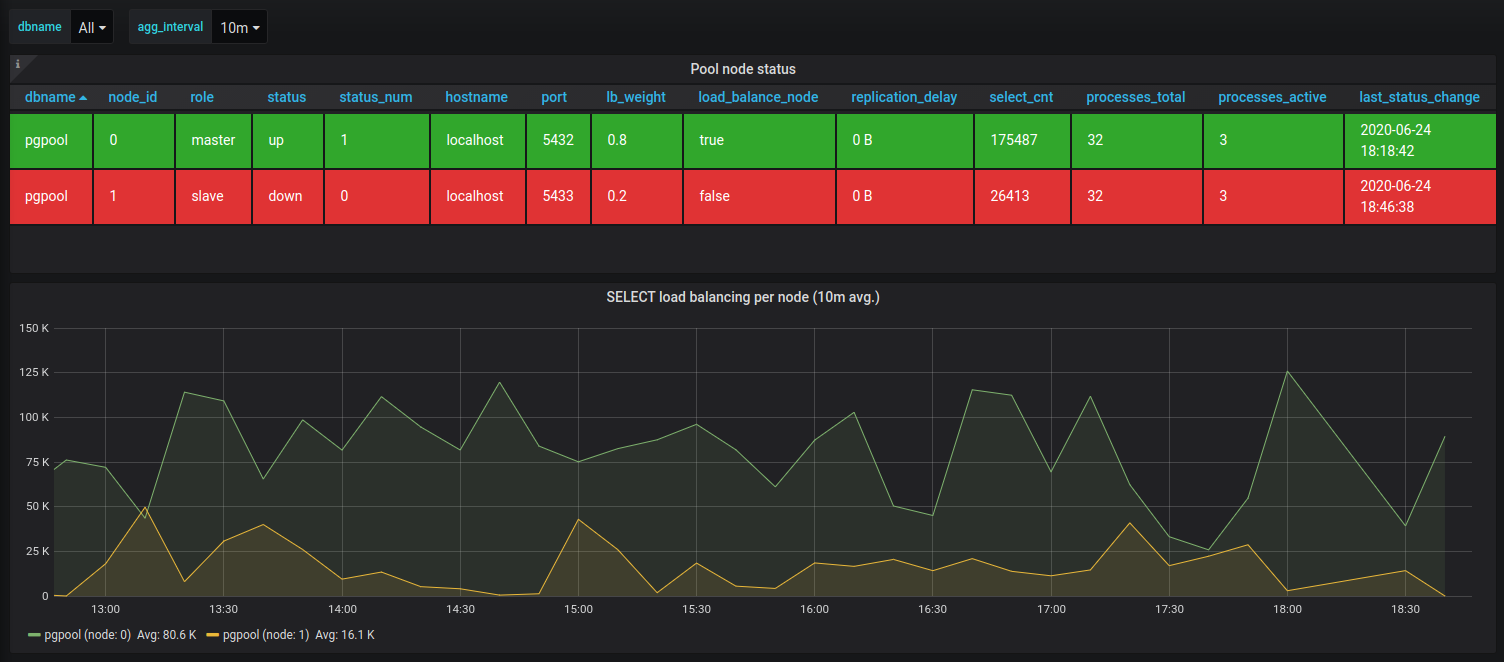
The built-in Grafana dashboard for Pgpool data looks something like that:
Prometheus scraping
pgwatch was originally designed with direct metrics storage in mind, but later also support for externally controlled Prometheus scraping was added.
To enable the scraping endpoint, add this commandline parameter:
--sink=prometheus://<host>:<port>/<namespace>.
If you omit host (Ex: --sink=prometheus://:9187), server listens on all
interfaces and supplied port. If you omit namespace, default is pgwatch.
Additionally, note that you still need to specify some metrics config as usual - only metrics with interval values bigger than zero will be populated on scraping.
Currently, a few built-in metrics that require some state to be stored between scrapes, e.g. the "change_events" metric, will currently be ignored. Also, non-numeric data columns will be ignored! Tag columns will be preserved though as Prometheus "labels".
Cloud providers support
Due to popularity of various managed PostgreSQL offerings there's also support for some managed options in sense of Preset Configs, that take into account the fact that on such platforms you get a limited user that doesn't have access to all metrics or some features have just been plain removed. Thus, to reduce server log errors and save time on experimenting there are following presets available:
- aws - for standard AWS RDS managed PostgreSQL databases
- azure - for Azure Database for PostgreSQL managed databases
- gce - for Google Cloud SQL for PostgreSQL managed databases